How do I monitor website statistics using cPanel?
Monitoring your website’s performance and visitor behavior is essential for understanding how your site is being used and where improvements can be made. With cPanel, tracking website statistics becomes easy, providing valuable insights into your site's traffic, visitor locations, pages viewed, and more. This guide will walk you through the steps needed to access and interpret these statistics using cPanel, helping you optimize your website's performance and tailor your content to meet your visitors' needs.
Monitoring Website Statistics in cPanel
1. Log into cPanel
2. Locating the 'Metrics' Section
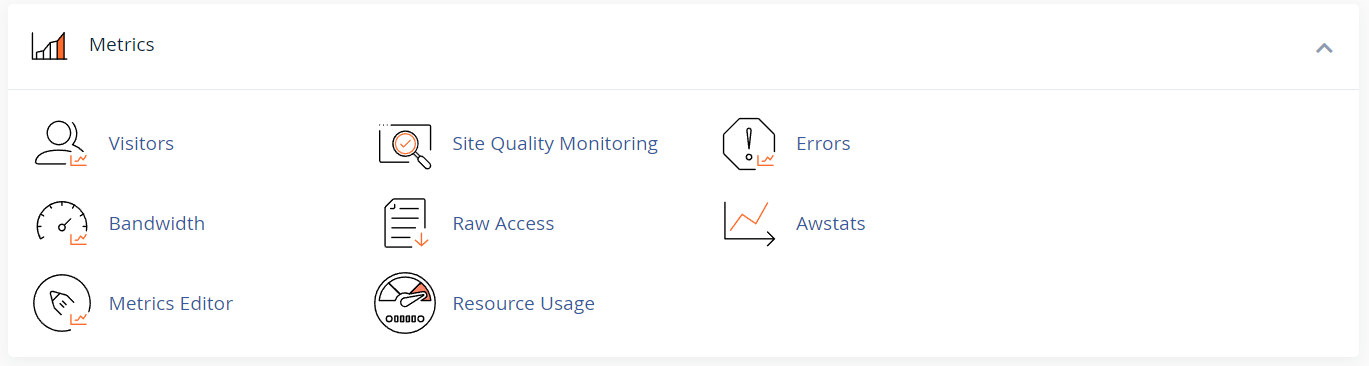
Once logged in, cPanel’s dashboard will appear. All the features are categorized into different sections. The section we are focusing on is Metrics.
- Scroll down to the Metrics section on the main dashboard.
- Under this section, you’ll find various tools that can help you monitor your website’s traffic, including:
- Visitors
- Awstats
- Raw Access
- Bandwidth
- Error Log
3. Using the 'Visitors' Tool
The Visitors tool provides real-time information about who is visiting your site. Here’s how to use it:
- Click on Visitors under the Metrics section.
- You’ll see a list of the most recent visitors to your website. Each entry shows details such as:
- IP address of the visitor
- Time of visit
- Pages viewed
- Referrer (the site or link the visitor came from)
This tool is useful for quick, up-to-date information on visitor activity.
4. Analyzing Data with 'Awstats'
Awstats is a comprehensive web analytics tool that offers detailed statistics on your site’s traffic. It’s a preferred tool for in-depth analysis.
- Click on Awstats under the Metrics section.
- Select the domain you wish to view statistics for.
- The dashboard will display a variety of data points, including:
- Monthly visitor statistics
- Number of unique visitors
- Number of visits and pages viewed
- Data on where visitors are coming from (countries, referrers)
- Browsers and operating systems used
- Search keywords
Awstats provides both summary data and detailed views, helping you understand trends over time.
5. Viewing Bandwidth Usage
The Bandwidth tool shows how much data your website is using. It’s important to monitor this, especially if your hosting plan has bandwidth limits.
- Click on Bandwidth under the Metrics section.
- The graph and stats will display your site’s bandwidth usage over time, broken down by HTTP, POP3, and FTP traffic.
- This data helps ensure you don’t exceed your bandwidth limits, which could slow down or temporarily disable your site.
6. Accessing Raw Visitor Logs with 'Raw Access'
If you prefer working with raw data, the Raw Access tool allows you to download detailed logs of all visitors to your site.
- Click on Raw Access under the Metrics section.
- Download the compressed file of your website’s log data.
- You can open this file using any text editor to view detailed visitor information.
7. Monitoring Error Logs
The Error Log tool is crucial for identifying any errors that visitors encounter when browsing your site.
- Click on Errors under the Metrics section.
- The log will show the most recent errors, such as 404 (page not found) errors, which can help you fix broken links or missing pages.


